Learn
Why Is My Blender Scene So Slow? A Practical Troubleshooting Guide
Find the bottleneck before changing settings. A repeatable workflow for slow viewports, animation playback, Cycles renders, and memory pressure.
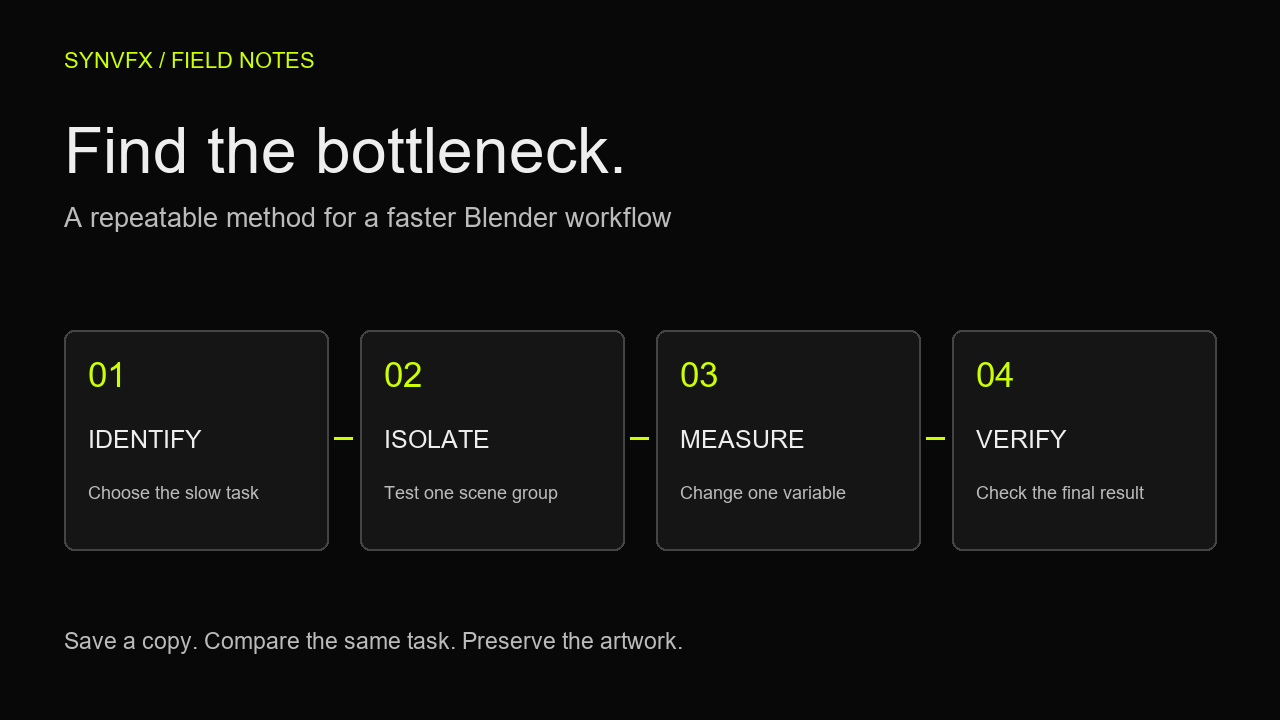
A scene can feel slow for several different reasons. Orbiting the viewport, scrubbing an animation, preparing a render, and sampling the final image are different workloads. A change that helps one may do nothing for another. Start by naming the operation that is slow, then test it consistently.
1. Define the slow task
Choose a small action you can repeat: orbit a fixed view for ten seconds, play the same frame range, or render the same camera and frame. Note your Blender version, render engine, hardware, and whether the scene recently changed. Keep the camera, resolution, samples, and other applications consistent during comparisons.
| Symptom | Start here | Keep constant |
|---|---|---|
| Viewport navigation stutters | Shading mode, geometry, and modifiers | View and visible scene |
| Playback slows or pauses | Animated evaluation and simulations | Frame range and playback settings |
| Render startup takes a long time | Scene preparation and memory | Camera, frame, and device |
| Image sampling is slow | Render device and image quality settings | Resolution and target quality |
| Blender stalls or runs out of memory | Geometry, textures, and available RAM/VRAM | Same task and scene version |
Write down the baseline instead of relying on how responsive the scene feels. For playback, record displayed performance and whether frames are skipped. For rendering, separate preparation from image sampling when the status display makes that distinction available. Repeat a short test to see whether the first run behaves differently from later runs.
2. Isolate the expensive part
In the diagnostic copy, divide the suspected objects or collections into groups. Disable one group for the operation being tested, repeat the task, and note the result. If performance changes substantially, narrow that group further. If it does not, restore it and test another group. This is a search for the component that changes the measurement, not a reason to delete half the artwork.
- Use controls appropriate to the test: viewport visibility and render visibility are different. An object hidden from the viewport can still render.
- Test modifier viewport toggles when investigating interactive evaluation; preserve render settings until you deliberately test a render change.
- Restore each experiment before starting the next, so results remain attributable.
- Check the full scene again: removing geometry can also change shadows, reflections, simulation interactions, and lighting.
3. Diagnose the viewport
Compare Solid shading with Material Preview or Rendered shading in the same view. If Solid is responsive but the other mode is slow, investigate material evaluation, lighting, textures, and the rendering workload. If all modes struggle, start with evaluated geometry, modifier stacks, and animated dependencies. This comparison is a useful clue rather than a definitive diagnosis.
Subdivision Surface has separate viewport and render levels. Higher subdivision levels create more vertices and consume more memory. In a copy, reduce the viewport level on suspected objects, then compare responsiveness. Keep the rendered silhouette and final render requirements separate from the level needed while editing.
Blender manual: Subdivision Surface →
For procedural setups, inspect the evaluated result rather than just the input mesh. Temporarily reduce density, repetition, or detail using the controls already exposed by the setup. Do not assume the base object count describes the amount of work the evaluated scene requires. Verify the camera view after choosing a lighter editing configuration.
4. Diagnose animation and simulation
Compare a static frame with playback over the same range. Test animated modifiers, rigs, and simulations separately in the copy. Playback settings that skip frames can make an animation appear smooth while hiding the cost of evaluating every frame, so keep those settings consistent when comparing results.
Baking stores simulation results so they can be reused. Blender recommends baking physics before rendering for repeatability; simulator-specific cache controls differ. Bake only after checking the simulation setup, frame range, and storage location. If you change inputs, confirm whether the cache must be cleared and rebuilt. A stale cache is not an optimization.
Blender manual: Baking Physics Simulations →
5. Separate render preparation from sampling
A long pause before sampling and a slow sampling phase need different experiments. For preparation, isolate expensive geometry and scene data. For sampling, compare the device and quality settings at the same camera and resolution. Do not change several settings together and then credit the improvement to a single option.
For Cycles, check the compute device configuration and the scene render device. Supported GPU backends depend on hardware and platform. GPU rendering is not guaranteed to be faster for every scene or device; benchmark your own workload. Compare both render time and image quality, and watch memory use.
Blender manual: GPU Rendering →
Use a representative crop or reduced-resolution test to shorten experiments, then validate at delivery resolution. Record which settings changed. Any sample or quality reduction must be judged against noise, detail, and animation consistency; a faster image that fails the brief is not a successful result.
6. Investigate memory pressure
Watch system memory and GPU memory during the exact operation that stalls. Texture files on disk are not a reliable measure of their loaded memory footprint. Test smaller textures on distant or low-detail surfaces, and compare at the final camera view. Reduce unnecessary evaluated geometry before assuming a hardware purchase is required.
Memory behavior varies by GPU backend. If the scene exceeds available GPU memory, supported configurations may use system memory, with a performance cost, or report an error. Avoid drawing conclusions from a single utilization number; compare the same scene before and after a controlled reduction.
7. Verify and keep an optimization log
- Restore the full scene and apply the smallest change supported by your measurements.
- Render a representative frame and inspect silhouettes, textures, shadows, reflections, and fine detail.
- For animation, inspect multiple frames and relevant simulation transitions.
- Repeat the baseline task and record the new result, including any quality tradeoff.
- Save the verified result separately from your untouched original.
A useful log needs only four columns: the task, the change, the measured result, and the visual consequence. Keep experiments that improve the actual bottleneck. Revert changes that make no meaningful difference. Repeat this process when the scene or delivery requirements change.
Where SYNAE fits
SYNAE is SYNVFX’s scene analysis and workflow guidance product. If that approach fits your work, explore its current product page. The diagnostic method above stands on its own: identify a repeatable task, isolate the cost, measure one change, and verify the result.
References above use Blender 4.5 LTS documentation. Control names and supported devices can vary between versions; consult the manual for the version you use. No synthetic benchmark results or unverified product features are presented here.